What this page is, and what it is not
Every figure on this page is a worked example, not a quotation and not an average you can apply to a holding.
We publish it because farmers ask what solar pays back, and the honest answer, “it depends”, is useless on its own. What is useful is showing what it depends on. So the six cases below are illustrations of the arithmetic, each with every input listed, so you can swap in your own figures and watch the answer move. Change the self-consumption assumption alone and the payback shifts by years.
Read them as a method to apply, not as a table to look your farm up in. The only payback figure that means anything for your holding comes from your own meter data, your own roof and your own connection offer.
The short answer
It depends almost entirely on what the farm does at midday, and the spread is much wider than the trade press suggests.
On current government figures, a packhouse or cold store pays back a solar array in about 4.2 years. A conventional dairy takes about 7.6 years. A small grazing holding takes 11.5 years and loses money over fifteen. The same array on the same farm can be a seven-year payback or a negative-value asset, depending on nothing more than how much of the output the farm can use itself.
The widely repeated “five to seven year payback” turns out to be roughly right for poultry units, robotic dairies and cold stores, and wrong for almost everything else.
Two things are wrong with the figure you have probably been given
The first is the date. Most payback figures still circulating for farm solar were calculated in 2022 and 2023, when commercial electricity was 35 to 45p a unit. It is not any more.
The second is more interesting, and almost nobody has noticed it. The figure quoted in the news and in most appraisals is 24.14p per kWh, the average non-domestic electricity price for the first quarter of 2026. That number is real, but it is an average across every non-domestic consumer in the country, from a village shop to a steelworks. It is not what a farm pays.
What a farm actually pays
The government publishes non-domestic electricity prices split by how much a business consumes in a year. The bands, and the prices for the first quarter of 2026 including the Climate Change Levy, come from DESNZ tables 3.4.1 and 3.4.2, published 30 June 2026.
| Band | Annual consumption | Price per kWh | What sits here |
|---|---|---|---|
| Very Small | 0 to 20 MWh | 35.02p | Small grazing or arable holding, farm office, workshop |
| Small | 20 to 499 MWh | 28.76p | Most working farms |
| Small/Medium | 500 to 1,999 MWh | 28.08p | Large multi-site poultry or horticulture business |
| Medium | 2,000 to 19,999 MWh | 25.00p | Substantial packhouse, cold store or glasshouse operation |
| Large and above | 20,000 MWh and up | 21 to 24p | Industrial |
| All-band average | 24.14p | The figure everyone quotes |
To place a holding, take its annual kWh from its bills and divide by a thousand to get MWh.
Almost every working farm lands in the Small band at 28.76p. A 200-cow dairy uses roughly 72 MWh a year. A 27,000-bird broiler house uses about 35 MWh. Even a 300 MWh robotic dairy is comfortably inside it. The 24.14p average actually describes a business consuming 2,000 MWh or more.
That is a 19% correction to the value of every unit the array displaces, and it shortens payback by roughly a sixth.
Two further points from the same data are worth knowing:
- The smallest consumers are going the other way. Since the first quarter of 2025 the Very Small band has run 32.85p, 37.07p, 37.36p, 36.11p, 35.02p, while the all-band average fell from 25.74p to 24.14p. Small non-domestic consumers have seen prices rise while the reported average fell.
- The Climate Change Levy rises from 0.775p to 0.801p per kWh in April 2026. It applies to imported units only, so it quietly increases the value of every unit you generate and use yourself.
The one calculation that decides everything
Since the Feed-in Tariff closed to new applicants, farm solar economics come down to a single sum:
the price of the electricity you avoid buying, multiplied by the share of your generation you actually use
A unit you use is worth 25 to 35p depending on your band. A unit you export is worth about 5p on an openly available non-domestic export tariff. So a unit used on the farm is worth roughly three to seven times a unit exported.
Everything else, including the price of the panels, matters less than that ratio.
A note on export prices
Comparison tables showing export rates of 15p, 20p or 25p are not describing anything a farm can get. Those rates are domestic, usually restricted to customers who bought the installation from that supplier, and several carry capacity caps of 15 to 30 kW that exclude a farm array outright. Which?’s April 2026 comparison sets out which are restricted.
The openly available tariffs that accommodate farm-scale capacity sit at around 4 to 6p. A power purchase agreement can reach 10 to 12p, but generally only above 25 to 30 kW, and below about 250 kWp the transaction costs outweigh the gain.
Treat export as a residual, not a revenue stream.
What a system costs
Here the official data has a limit worth knowing about. DESNZ solar cost data, updated 28 May 2026, covers three size bands: 0 to 4 kW, 4 to 10 kW and 10 to 50 kW. That is all of it. The series is built from the MCS database, so it stops where MCS coverage stops.
Above 50 kW there is no official UK cost benchmark for solar at all. Every figure in circulation for a 100 kW or 250 kW farm array is trade press, trade body or an installer’s quotation. Anyone implying otherwise is overstating what is published.
For non-domestic installations in the financial year to March 2026, the official means are:
| Band | Published mean | Ex 20% VAT |
|---|---|---|
| 0 to 4 kW | £1,892/kW | about £1,577/kW |
| 4 to 10 kW | £1,533/kW | about £1,278/kW |
| 10 to 50 kW | £1,259/kW | about £1,049/kW |
The published figures include VAT where it applies. A VAT-registered farm reclaims it, so the ex-VAT column is the one that belongs in an appraisal.
This also settles an apparent contradiction. The trade press has quoted “around £1,000 per kW at 50 kW” since 2023, and the official data says £1,259. Both are correct. They are quoting different tax treatments. Once VAT comes out, they agree almost exactly.
Two other things the data shows. Costs are falling, with the 10 to 50 kW non-domestic mean down from £1,307 to £1,259 in a year. And non-domestic installation volume nearly doubled, from 52,890 to 88,788 in a year.
Above 50 kW, the working trade figures are about £900 per kW at 100 to 150 kW and about £750 per kW above 150 kW.
Six worked examples
These are illustrations, not benchmarks. Every assumption is listed below the table so that any figure here can be challenged, and no row here is a substitute for the arithmetic run on your own holding.
| Holding | System | Cost per kW | Capital | Import price | Self-use | Year 1 benefit | Payback | Value over 15 years |
|---|---|---|---|---|---|---|---|---|
| Packhouse or cold store | 500 kWp | £750 | £375,000 | 25.00p | 80% | £89,500 | 4.2 years | £510,000 |
| Robotic dairy | 150 kWp | £900 | £135,000 | 28.76p | 75% | £29,307 | 4.7 years | £155,000 |
| Poultry, controlled environment | 100 kWp | £900 | £90,000 | 28.76p | 70% | £18,469 | 4.9 years | £92,700 |
| Dairy, 200 cows | 50 kWp | £1,049 | £52,458 | 28.76p | 50% | £7,096 | 7.6 years | £17,700 |
| Small mixed farm | 30 kWp | £1,049 | £31,475 | 28.76p | 45% | £3,937 | 8.2 years | £7,400 |
| Small grazing or arable holding | 10 kWp | £1,278 | £12,775 | 35.02p | 30% | £1,161 | 11.5 years | minus £1,300 |
Assumptions. Yield 900 kWh per kWp per year, a mid-England roof in reasonable condition. Degradation 0.75% a year, which is the measured UK field rate rather than the 0.4 to 0.5% manufacturers warrant. Export at 5p. Operating costs of £10 per kWp a year covering maintenance, cleaning, monitoring and insurance. Value over fifteen years is a net present value discounted at 5% in real terms, the rate the government uses for solar appraisal. Capital costs are ex-VAT, taken from the official data below 50 kW and from trade figures above it.
The row that matters most
Hold the same 50 kWp array on the same dairy and change only one thing:
| Variant | Payback | Value over 15 years |
|---|---|---|
| Modelled at the 24.14p national average, as most appraisals do | 8.9 years | £7,400 |
| Modelled at the 28.76p price the farm actually pays | 7.6 years | £17,700 |
| Same again, but the farm exports three quarters of what it generates | 12.4 years | minus £8,800 |
The first two rows are the price correction. The second and third rows are the whole argument.
A farm that exports most of its generation does not have a slower investment. It has a bad one. No amount of roof area fixes that, and no installer discount fixes it either. The only things that fix it are using more of the output, or building a smaller array.
Which farms can use the output, and which cannot, is set out in Which farms does solar actually suit?
What this table deliberately leaves out
No figure here should reach a client unadjusted. Four things are excluded on purpose, and each has its own guide.
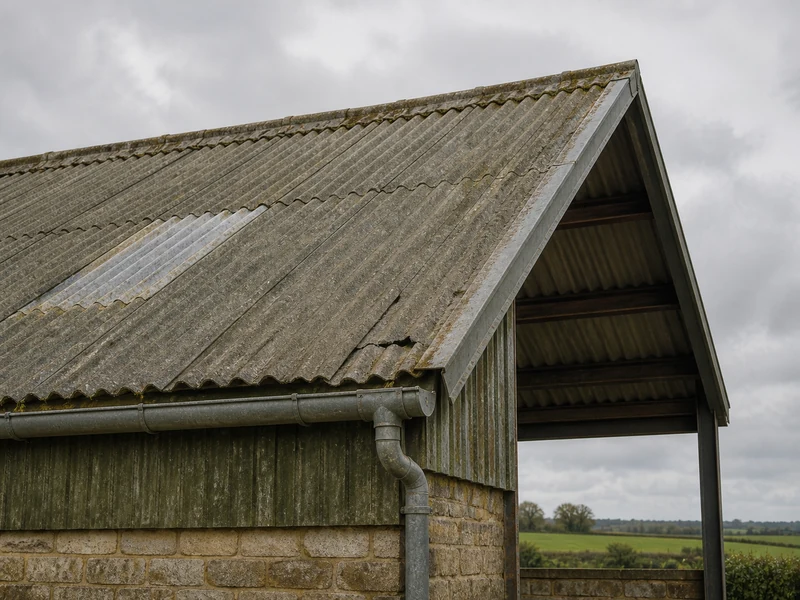
Roof works. No asbestos removal, no re-roofing, no structural strengthening. Adding a £20,000 re-roof to the dairy case moves it from 7.6 years to roughly 10.4. On a shed built before 2000 this is the most common reason a good-looking project does not happen. See The four things that decide whether a barn roof can take solar.
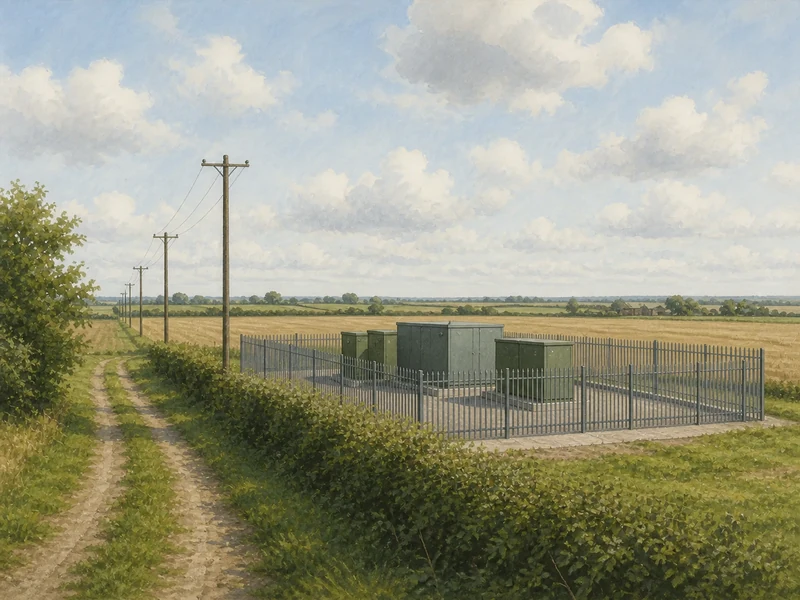
Grid works. No network reinforcement, no export limitation equipment, no three-phase upgrade. On a rural connection any of these can be the largest single line in the project. See Talk to the network operator before you talk to an installer.
Inverter replacement at year 12 to 15. It falls after payback in most of these cases, so it barely moves that column, but it reduces the fifteen-year values.
Any grant. Correctly, because there is none open in England. See Farm solar grants in 2026.
We have also held the electricity price flat in real terms. Network charges are forecast to rise sharply, and standing charges are not reduced by generating your own power, so if anything this makes the table conservative.
What we could not establish
Three things, stated plainly rather than smoothed over.
Whether VAT is applied uniformly in the official cost data. The methodology says costs include “VAT where applicable”. Non-domestic work on a farm building carries 20%, and the zero rate for energy-saving materials does not extend to agricultural or commercial buildings, so the adjustment above is almost certainly right. It is the single assumption doing the most work in this article, and we have asked DESNZ to confirm it.
The cost data measures declared net capacity, not total installed capacity. Where an array is deliberately oversized against its inverter, the cost per kW reads slightly higher than the cost per panel kilowatt. The effect is small and it makes our figures marginally conservative.
No published net present value for UK farm solar appears to exist. We looked. The return figures in circulation, typically “about 20%” or “15 to 40%”, have no stated methodology and are almost certainly not discounted returns. The table above is our own work, which is why every input is listed.
Four questions to ask before accepting any payback figure
- What electricity price does it assume, and which DESNZ band is that? If the answer is 24p or “the average”, it is understating your saving. If it is 35 to 45p, it was written three years ago.
- What self-consumption percentage does it assume, and where did that come from? Almost every proposal models this from a generic profile rather than from your meter. Twelve months of your own half-hourly data is the only real answer.
- Does it include the roof and the grid connection? Ask specifically about asbestos, structural survey and the network operator’s response.
- Is the payback simple or discounted, and does it include maintenance and inverter replacement? Most published farm paybacks are simple, undiscounted and exclude both.
Figures current as at 1 September 2026, modelled on DESNZ non-domestic prices for Q1 2026 and DESNZ solar cost data for the financial year to March 2026. This page is reviewed each quarter when new price data is published. It is general information about how the arithmetic works and is not advice on any particular holding.