The short answer
A unit of electricity you use on the farm is worth three to seven times a unit you export. So the question that decides a solar investment is not how much you can generate. It is how much you can use at the moment you generate it.
Poultry units, cold stores, packhouses and robotic dairies use most of what they make. Conventional dairies use about half. Upland grazing and dryland arable use very little. The same array produces completely different investments on each.
Start with the demand, not the roof
The instinct is to look at the barn roof and work out how many panels fit. That is the last question, not the first.
A 250 kWp array on a poultry unit and the identical array on a grazing holding are not the same investment with different returns. They are two different propositions, one of which is sound and one of which loses money. The roof is the same in both cases.
What the official data says about farm electricity use
Defra’s Energy use on farms in England 2023/24, published 31 March 2026 from the Farm Business Survey, is the best free evidence available and is very rarely cited.
Proportion of farms using 150 kWh per hectare a year or more:
| Farm type | Farms at 150 kWh/ha or above |
|---|---|
| Horticulture | 52% |
| Specialist pigs and poultry | 50% |
| Dairy | 41% |
| Cereals, grazing livestock, mixed | Most below 50 kWh/ha |
The same survey found that 32% of farm businesses generate renewable energy and 27% generate solar. Of those generating solar, 84% is on farm building roofs and only 10% is field-based. Reducing energy bills was the primary motivation for 78%.
That 84 to 10 split is worth pausing on. Rooftop is more than eight times as common as field-scale, and yet almost all the advisory content published for landowners is about leasing fields to developers.
One warning about this data. It reports intensity per hectare, which is a trap for solar sizing. A 400-hectare arable farm at 40 kWh per hectare uses 16 MWh a year, which is genuinely small. A four-hectare intensive poultry site can use twice that. Land area tells you nothing useful here. Annual kWh and the shape of the day tell you everything.
Enterprise by enterprise
Poultry, controlled environment: the strongest case
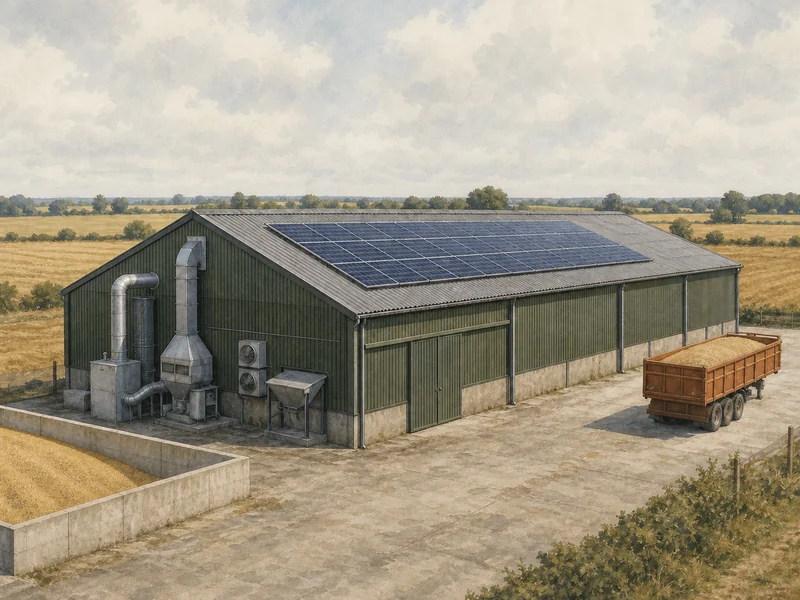
Ventilation and lighting run continuously, and ventilation load rises with ambient temperature. That temperature correlation is the important part: the hotter and sunnier it is, the more fan power the shed draws and the more the array generates. No other farm enterprise has that natural alignment.
Realistic self-consumption on an appropriately sized array: 65 to 80%.
Two caveats. First, ammonia and dust from shed ventilation degrade panels and corrode mounting hardware, which raises cleaning frequency and pushes degradation toward the high end of the measured range. Second, and more important for broilers: electricity is not where the money is. A 27,000-bird broiler house uses about 35 MWh of electricity a year against 240 to 270 MWh of heat, on Teagasc’s figures. Solar addresses the smaller of those two numbers. It is still a good investment. It is not a solution to the site’s energy cost.
Cold stores and packhouses: excellent, and often overlooked
Refrigeration runs continuously and, like poultry ventilation, works harder when it is hot and sunny. Packhouse and grading lines run daytime shifts. Both are directly coincident with generation, and horticulture has the highest electricity intensity of any Defra category.
Realistic self-consumption: 70 to 85%.
There is a useful historic example. A carrot and parsnip processing site in Cambridgeshire installed 1.2 MW across 30,000 square metres of roof. About 75% of its energy was consumed in daytime hours, and even so the array only covered about 20% of total energy use, because the site was demand-rich relative to the roof available. That is the ideal configuration for behind-the-meter solar: undersize the array against demand and you approach 100% self-consumption.
Robotic dairy: strong, and the exception among dairies
Robots milk across all twenty-four hours, which flattens the load and creates genuine midday demand that a conventional parlour does not have.
Park Farm at East Kilbride is the best documented UK example: 410 cows, eight robots, about 300,000 kWh a year, a 270 kWp array with a 108 kWh battery, 75% self-consumption and a five to six year payback.
Conventional dairy: moderate, and weaker than it looks
This one catches people out, so it is worth setting out properly.
Dairy electricity splits roughly as milk cooling 38%, water heating 30% and vacuum pump 20%, on AHDB’s figures. Cooling and vacuum are milking-coincident, not midday-coincident. Twice-a-day milking peaks around 5am to 8am and 3pm to 6pm, which are the shoulders of the solar curve rather than its peak. Water heating is usually timed deliberately to the cheap night rate.
Realistic self-consumption without storage: 40 to 60%.
And there is a second effect that most appraisals miss entirely. A dairy that has already optimised onto a night tariff has both a lower effective price to displace and a load profile deliberately moved away from solar hours. AHDB’s work at Rhual Dairy records 33% of consumption on the night rate at a 15.2p single-rate equivalent. Solar and night-rate optimisation are partly substitutes, not complements.
Check the incumbent tariff before modelling savings at the day rate. If a client is on a heavily night-weighted tariff, the honest saving is smaller than the headline suggests.
Pigs, indoor: good, but inferred
The same continuous ventilation logic as poultry, generally at lower intensity per unit floor area. Defra groups pigs with poultry at 50% of holdings above 150 kWh per hectare.
Estimated self-consumption: 60 to 75%. We could not find a UK case study with measured figures, so treat this as engineering reasoning rather than evidence.
Arable: usually weak, with one exception
Cereals farms sit predominantly below 50 kWh per hectare, the lowest intensity band, and 5% of them use no mains electricity at all.
Grain drying is a large load but an extremely concentrated one, running intensively for a few weeks in August and September, often overnight, and frequently on gas or oil rather than electricity. Its annual coincidence with solar is poor despite the peak draw.
Irrigation pumping is the genuine exception. Summer daytime pumping matches peak generation well, and holdings with significant irrigation, typically East Anglian roots and vegetables, can present a good case. Dryland combinable-crop farms generally cannot.
Self-consumption: 40 to 60% with real irrigation, 20 to 35% without.
Glasshouse horticulture: the biggest trap in the list
Horticulture has the highest headline electricity intensity of any category, which makes it look like the obvious candidate. Sub-sectors within it differ enormously.
Supplementary lighting runs in winter and at night, precisely when there is no solar. A glasshouse’s headline consumption badly overstates its solar potential.
Self-consumption where lighting dominates: 25 to 40%.
Do not treat “horticulture” as one thing. The cold store on the same holding may be an excellent candidate while the glasshouse is a poor one.
Grazing livestock and upland: the weakest case
Defra places grazing livestock in the lowest intensity band. Base load is yard lighting, water pumping and a workshop.
Self-consumption: 15 to 30%. At that level, behind-the-meter solar is effectively an export project and should be appraised as one, which in current export conditions usually means it does not pay. Our worked table in What does farm solar actually pay back in 2026? puts a 10 kWp system on this kind of holding at 11.5 years with a negative fifteen-year value.
The summary table
| Enterprise | Match to the solar curve | Realistic self-consumption without storage | How confident we are |
|---|---|---|---|
| Poultry, controlled environment | High. Ventilation rises with sunshine | 65 to 80% | Good. Multiple cases |
| Cold store or packhouse | High | 70 to 85% | Moderate. One strong case |
| Robotic dairy | High. Load flattened across 24 hours | About 75% | Good. Measured |
| Pigs, indoor | High | 60 to 75% | Weak. Inferred |
| Conventional dairy | Moderate. Milking-coincident | 40 to 60% | Moderate |
| Arable with irrigation | Moderate, seasonal | 40 to 60% | Weak |
| Glasshouse with supplementary lighting | Low. Winter and night load | 25 to 40% | Weak. Inferred |
| Arable, grain drying only | Low. Concentrated in August and September | 20 to 35% | Weak. Inferred |
| Grazing livestock, upland | Very low | 15 to 30% | Moderate |
Rows marked inferred rest on the characteristics of the load rather than on UK measurement. We have said so rather than presenting all nine rows with equal confidence.
The orientation point that surprises people
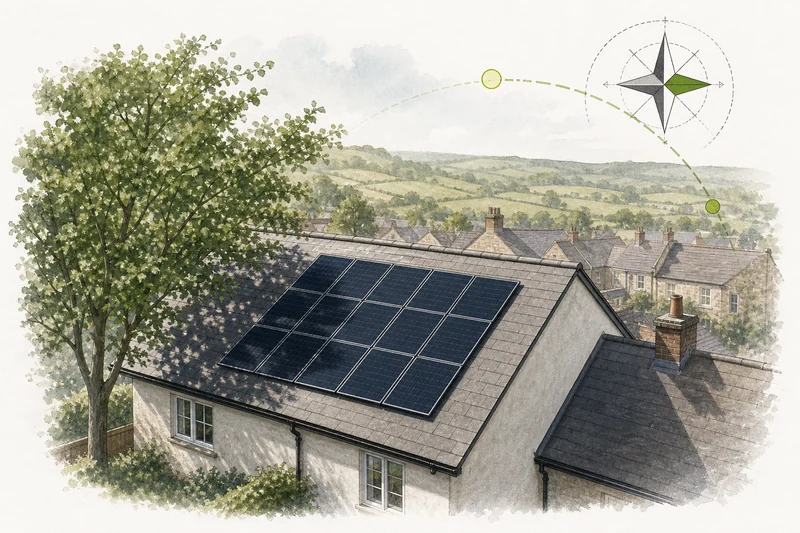
An east-west split array generates around 15 to 20% less electricity than a due south one. On a farm roof that is often the only option anyway, since portal-frame sheds are oriented for prevailing wind, muck handling and vehicle access rather than for the sun.
That is not necessarily bad news. An east-west array produces a flatter, wider generation curve rather than a tall midday peak. For a dairy milking at 5am and 4pm, that can deliver a higher self-consumption fraction despite lower total generation, and therefore a better return.
There is a striking example from a dairy at Kilmeaden in County Waterford, which installed a 27 kW bifacial vertical solar fence facing east and west, 150 metres long. It matches the morning and evening milking peaks directly, and the farm has no battery at all.
Total kilowatt hours is the wrong thing to optimise for a behind-the-meter system. Matching the load is the right thing.
The honest limitation of everything above
There is no public dataset of half-hourly farm load profiles by enterprise type in the United Kingdom.
AHDB publishes consumption by process, so we know milk cooling is 38% of dairy electricity, but it does not publish consumption by time of day. Defra publishes intensity by farm type but not shape. The only academic work on behind-the-meter self-consumption we could find uses Australian household data from 2010 to 2013.
Which means the self-consumption percentages in installer proposals, including the ranges in this article, are modelled from generic profiles rather than measured from the holding.
The only real answer is twelve months of the farm’s own half-hourly data, available from its supplier or meter operator, usually for free and usually within a fortnight. Solar Energy UK makes the same point: a credible business case needs half-hourly demand, import and export limits, generation, storage and tariff structure modelled together.
If a proposal quotes a self-consumption percentage and the holding’s own half-hourly data was never requested, the percentage is an assumption wearing the clothes of a measurement.
What to do with this
- Place the enterprise in the table above. That gives you the order of magnitude and tells you whether the conversation is worth having.
- Get the half-hourly data before anything is specified. Nothing here substitutes for it.
- Do the cheap load work first. AHDB’s work at Rhual Dairy identified £5,400 a year from heat recovery, variable speed drives and efficient compressors against a £20,000 bill, with no capital risk and no roof works.
- Then size the array to the demand you have established, not to the roof you happen to own.
Figures current as at 1 September 2026. Enterprise percentages marked “inferred” are engineering judgement from load characteristics, not UK measurement, and are flagged as such throughout. Reviewed annually against the Defra Farm Business Survey.